Imaging Data Reduction Cascade
The association map in Fig. 32 shows how imaging data cascades through the pipeline.
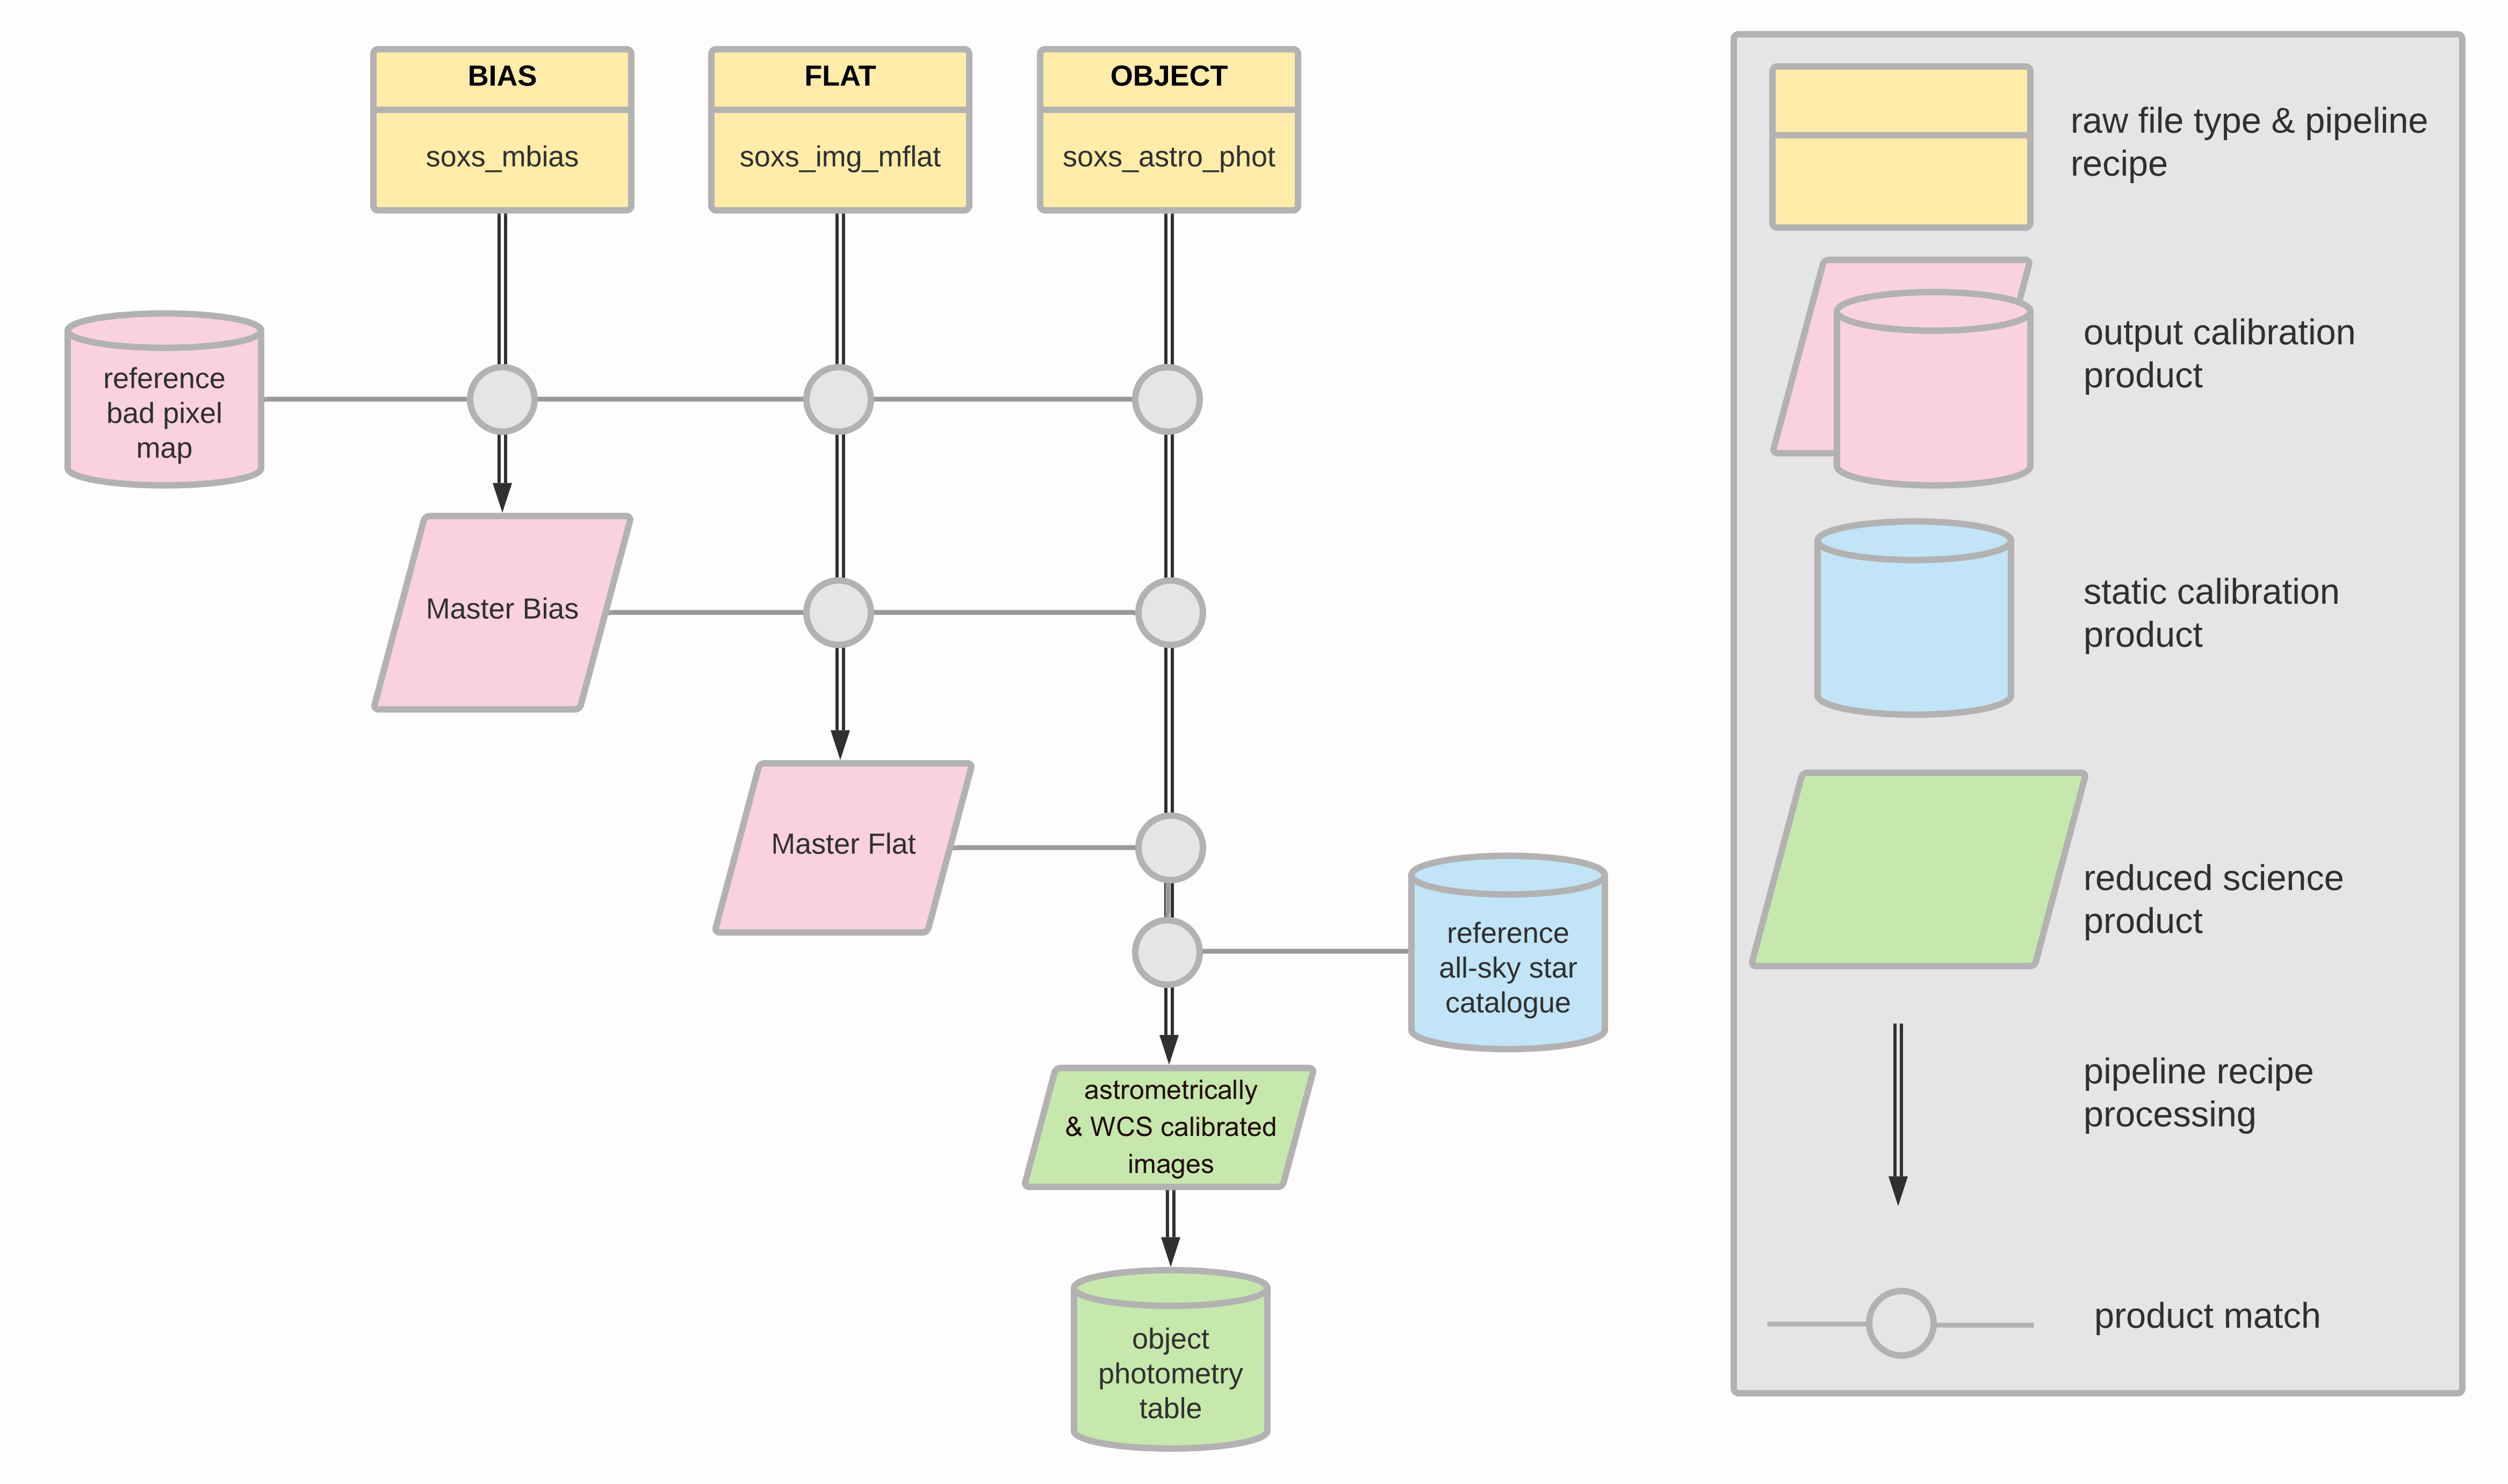
Fig. 32 The SOXS imaging data reduction cascade. The input data, calibration products required and the output frames are shown for each recipe implemented in the pipeline. Each vertical line in the map depicts a raw data frame, the specific recipe to be applied to that frame and the data product(s) output by the recipe. Horizontal lines show how subsequent pipeline recipes use those output data products. Time loosely proceeds from left to right (recipe order) and top to bottom (recipe processing steps) on the map.
Imaging Data
Daily Calibration Data
ACAM bias frames
ACAM flat field frames
Static Calibration Data
Reference bad pixel map
Reference all-sky catalogue of stars (Refcat2 [TDF18]).
Intermediate Data Products
Master bias frame
Master flat frame
Astrometrically calibrated science frame
Table of object photometry
Output Data Products
Product |
Description |
|---|---|
Acquisition Camera Images |
ugrizy astrometrically and photometrically (griz only) calibrated to Refcat2 [TDF18]. |
Note ACAM reductions have not yet been finalised in the pipeline