soxs_nod
The soxs_nod recipe reduces the science frames produced by the NTT and SOXS from a nodding mode observation block.
Usage
The soxs_nod recipe can be run with the following convention:
soxspipe [-Vx] nod <inputFrames> [-o <outputDirectory> -s <pathToSettingsFile>]
To rerun a previously executed soxs_nod recipe, you can find the execution command at the end of the recipe log file (found in the workspace products/soxs_nod directory). Use the -x flag to overwrite the product files if they already exist. For example, from the root of your workspace, you would run a command like:
soxspipe nod sof/20260111T041914_NIR_3_NOD_STD_FLUX_SLIT1_0_150_0S_SOXS.sof -s ./sessions/base/soxspipe.yaml -x
To adjust the default settings for the soxs_nod recipe, open the soxspipe.yaml file referenced in the command above in a text editor, navigate to the soxs_nod dictionary, save the file and rerun the recipe command. The settings’ descriptions can be found in Table 30.
Product files are written in the products/soxs_nod, and QC plots are in the qc/soxs_nod workspace directory. A report of the product files, QC plots and metrics is also printed to the terminal. The QC metrics calculated for soxs_nod are found in Table 33.
Reduction Tips
Typically, this recipe fails because the object trace is not found or fitted correctly. This may simply be because the object is too faint in the data, but a few settings can be adjusted to try and secure a fit. First, increase slice-length by a few pixels and try the recipe again. If this does not work, adjust poly-fitting-residual-clipping-sigma to both lower and higher levels (by 1 or 2 sigma each time) and rerun the recipe each time.
Parameters
Parameter |
Description |
Type |
Entry Point |
Related Util |
|---|---|---|---|---|
|
divide image by master flat frame |
bool |
settings file |
- |
|
fit and subtract the intra-order background light |
bool |
settings file |
- |
|
If True, each A and B stacked frame for each offset is saved as 2D image |
bool |
settings file |
- |
|
use la cosmic to remove CRHs before extraction |
bool |
settings file |
- |
|
the sigma clipping limit used when stacking frames into a composite frame |
float |
settings file |
|
|
the maximum sigma-clipping iterations used when stacking frames into a composite frame |
int |
settings file |
|
|
the length of the ‘slit’ used to collect object flux (in pixels). Doubles are boxcar extraction aperture size. |
int |
settings file |
|
|
degree of the polynomial used to fit the dispersion-direction profiles of the object. |
int |
settings file |
|
|
sigma clipping limit when fitting the object profile (global over the order) |
float |
settings file |
|
|
sigma clipping limit when fitting the dispersion-direction profiles of the object |
float |
settings file |
|
|
maximum number of clipping iterations when fitting dispersion-direction profiles |
int |
settings file |
|
|
number of cross-order slices per order |
int |
settings file |
|
|
length of each slice (pixels) |
int |
settings file |
|
|
width of each slice (pixels) |
int |
settings file |
|
|
height gaussian peak must be above median flux to be “detected” by code (std via median absolute deviation) |
float |
settings file |
|
|
degree of order-component of global polynomial fit to object trace |
int |
settings file |
|
|
degree of y-component of global polynomial fit to object trace |
int |
settings file |
|
|
clipping limit (median and mad) when fitting global polynomial to object trace |
float |
settings file |
|
|
maximum number of clipping iterations when fitting global polynomial to object trace |
int |
settings file |
|
|
degree of bsplines used to fit the inter-order background (if |
int |
settings file |
|
|
standard deviation of Gaussian kernel used to smooth background image (if |
int |
settings file |
|
|
maximum number of iterations used to fit the polynomial to the response function |
int |
settings file |
|
|
degree of the polynomial used to fit the response function |
int |
settings file |
Input
Data Type |
Content |
Related OB |
|---|---|---|
FITS Image |
Raw science frames of targets observed in nodding mode |
|
FITS Image |
Master flat frame (optional) |
- |
FITS Table |
order location table containing coefficients to the polynomial fits describing the order locations. |
- |
FITS Table |
Dispersion map table giving coefficients of polynomials describing 2D dispersion/spatial solution |
- |
FITS Image |
Dispersion map FITS image with 3-extensions (wavelength, slit-position and echelle order number) |
- |
Output
Label |
Content |
Data Type |
PRO CATG |
PRO TYPE |
PRO TECH |
|---|---|---|---|---|---|
|
Table of the extracted source in each order |
FITS |
|
|
|
|
Table of the extracted, order-merged |
FITS |
|
|
|
|
Table of the flux calibrated extracted spectrum |
FITS |
|
|
|
|
Response function coefficients |
FITS |
|
|
|
|
Efficiency estimate |
FITS |
|
|
|
|
Ascii version of extracted source spectrum |
TXT |
- |
- |
- |
|
Residuals of the object trace polynomial fit |
- |
- |
- |
|
|
Fitted intra-order image background |
- |
- |
- |
|
|
QC plot of extracted source |
- |
- |
- |
|
|
QC plot of extracted order-merged source |
- |
- |
- |
|
|
QC plot of extracted order-merged, flux-calibrated source |
- |
- |
- |
|
|
Response curve QC plot. |
- |
- |
- |
QC Metrics
Label |
Description |
Unit |
Acceptable Range |
|---|---|---|---|
|
Fraction of bad pixels |
VIS: [0.0,0.01], NIR: [-0.001,0.01] |
|
|
Mean inner-order pixel value |
electrons |
VIS: [-40,60], NIR: [-40,60] |
|
Sum of all inner-order pixel values |
electrons |
- |
|
Number of bad pixels |
- |
|
|
Number of orders containing an object trace |
VIS: 4 , NIR: 15 |
|
|
Number of samples where a continuum is detected |
- |
|
|
Fraction of samples where a continuum is detected |
VIS: [0.93,1.0] NIR: [0.7,1.0] |
|
|
Total number of samples along orders |
- |
|
|
Number of continuum sample clipped during solution fitting |
- |
|
|
Fraction of detected continuum samples clipped during solution fitting |
VIS: [0.0,0.2], NIR: [0.0,0.3] |
|
|
Maximum residual in continuum fit along x-axis |
px |
- |
|
Minimum residual in continuum fit along x-axis |
px |
- |
|
Std-dev of residual continuum fit along x-axis |
px |
VIS: [0.0,0.2] |
|
Maximum residual in continuum fit along y-axis |
px |
- |
|
Minimum residual in continuum fit along y-axis |
px |
- |
|
Std-dev of residual continuum fit along y-axis |
px |
NIR: [0.0,0.5] |
|
The median efficiency (global) |
VIS: [0.04,0.30], NIR: [0.02,0.2] |
|
|
The median signal-to-noise ratio across all orders (global) |
VIS: [50,1000], NIR: [7,200] |
|
|
The median efficiency (order N) |
- |
|
|
The median signal-to-noise ratio across all orders (order N) |
- |
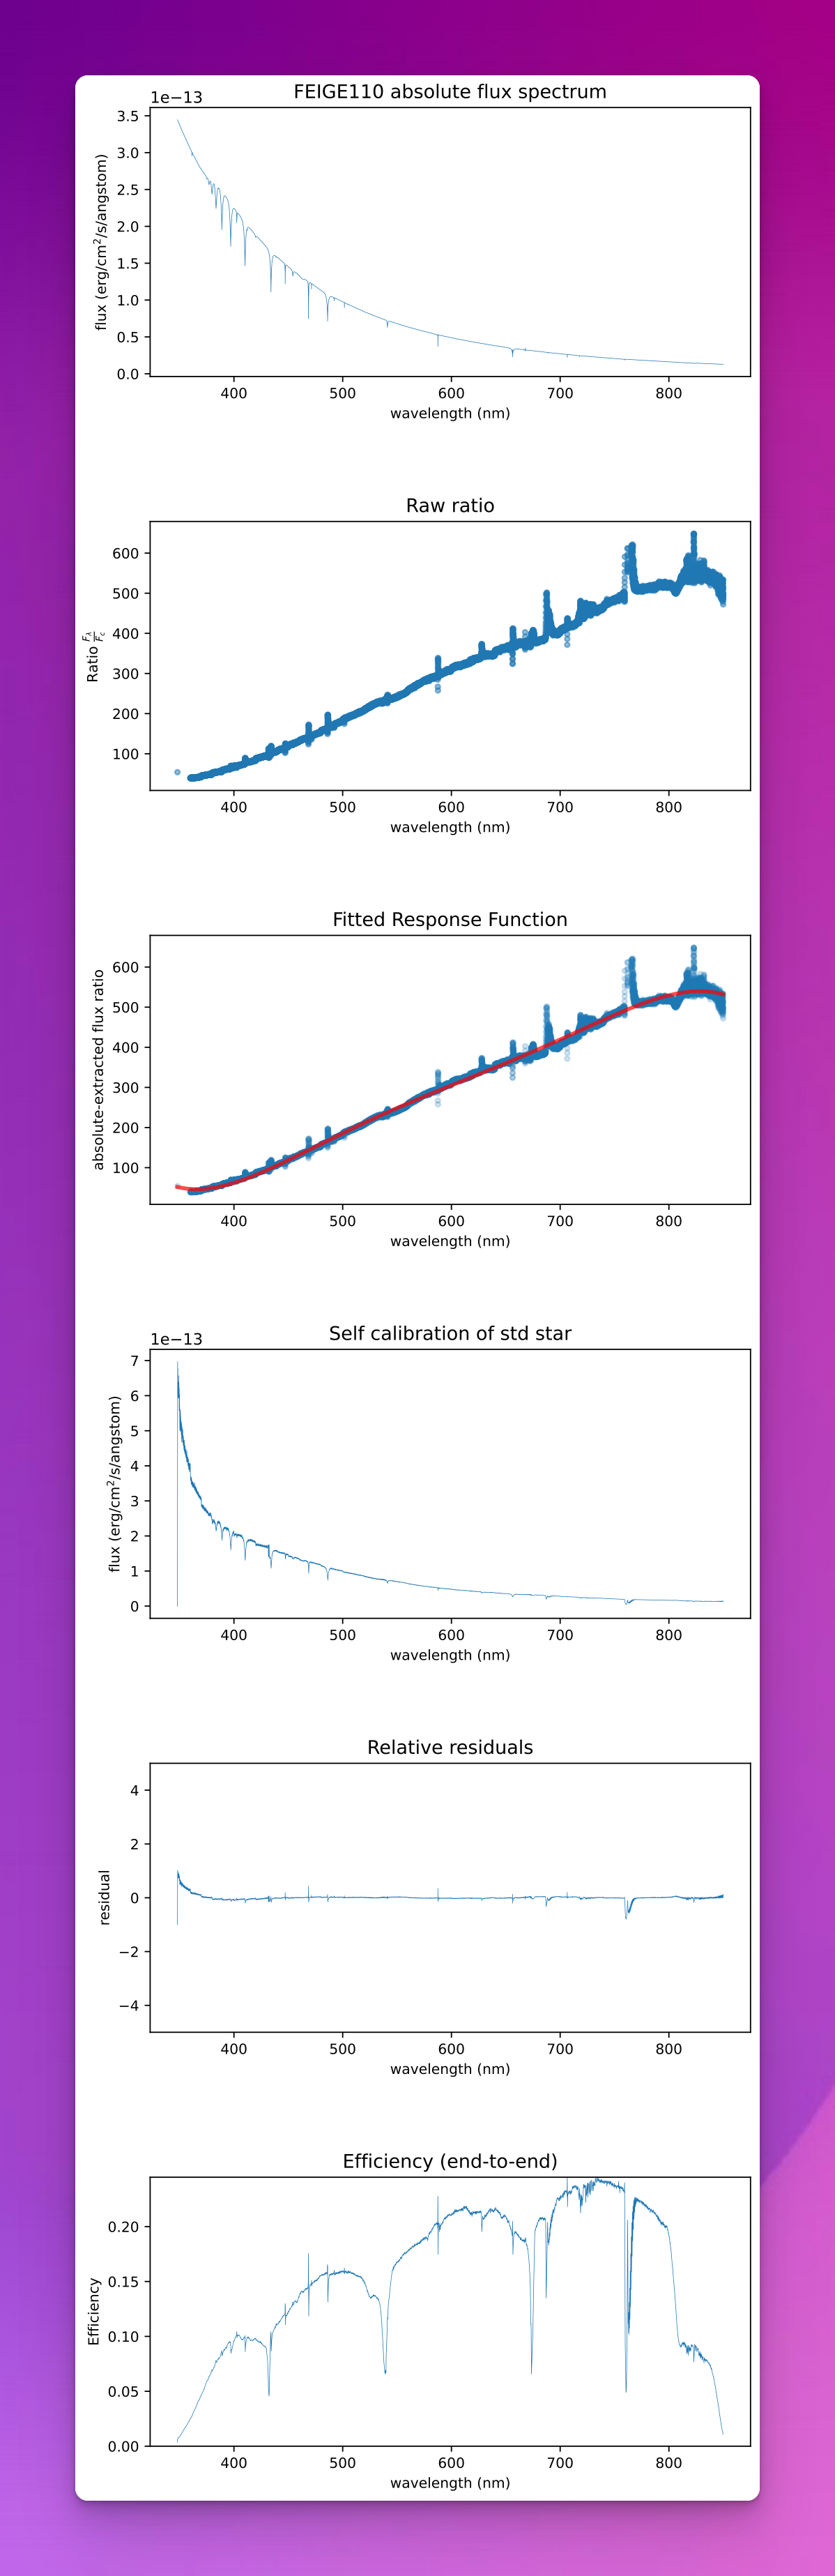
Fig. 17 The output of the reponse_function utility (used by nodding and stare recipes) used in the reduction of spectroscopic standard star spectra. The third panel shows th fittted response curve, and the final panel shows the overall efficiency of the instrument across the entire wavelength range of the spectrograph arm.